Forecast scores are metrics that quantify how well probabilistic or point forecasts match the observed outcomes
MAE
Measures the average magnitude of the errors in the predictions. Lower values mean predictions are closer on average to actual data
MSE
Measures the average of the squared differences between forecast and observation. Lower values mean fewer and/or smaller large errors in predictions
Continuous Ranked Probability Score (CRPS)
Evaluate how well the predicted cumulative distribution function (CDF) matches the observed outcome. The prediction is modeled as a log-normal distribution for this calculation. The CRPS generalizes the Mean Absolute Error (MAE) to probabilistic forecasts. Lower CRPS values indicate better predictive performance.
Log Score
Measures the log-probability assigned to the observed value by the forecast distribution. The prediction is modeled as a log-normal distribution for this calculation. Larger log score values indicate better predictive performance.
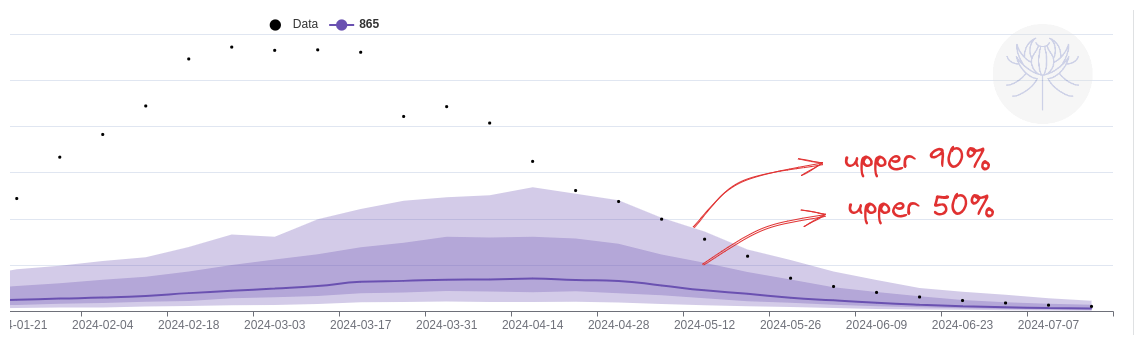
Interval Score
Evaluates prediction intervals (e.g., 90% confidence intervals) of the forecast. The interval score penalizes forecasts when the observed value falls outside the predicted interval and favors narrower intervals when the observation is within the range. Lower values indicate better predictive performance.
Weighted Interval Score (WIS)
The WIS is a metric that combines multiple interval scores and serves as an approximation of the CRPS when forecasts are provided in the form of quantiles. Lower values indicate better predictive performance.
 or line